|

|
DataShare Metro Richmond
Bridging the Gap ... Data Serving Us All
|
|
|
|
|
|
|
| |
Income And Poverty Data for Randolph
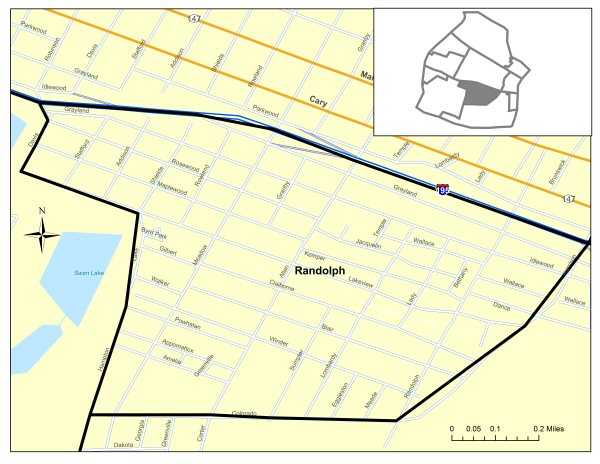 Please note: Large Map images are approximately 800 Kb - 1 Mb in size. Please note: Large Map images are approximately 800 Kb - 1 Mb in size.
| |
| 1999 median household income |
* |
$31,112 |
$46,677 |
| 1999 median family income |
* |
$38,348 |
$54,169 |
| 1999 per capita income |
* |
$20,337 |
$23,975 |
| Total households |
1,791 |
84,566 |
2,700,335 |
| Income $0-$24,999 |
48.46% |
40.32% |
24.61% |
| Income $25,000-$39,999 |
20.04% |
20.59% |
17.93% |
| Income $40,000-$59,999 |
16.47% |
16.98% |
19.89% |
| Income $60,000-$74,999 |
6.92% |
7.35% |
11.10% |
| Income $75,000+ |
8.10% |
14.75% |
26.47% |
| |
| Population for whom poverty status is determined |
4,316 |
188,116 |
6,844,372 |
| Total Population Below Poverty Level |
986 |
40,185 |
656,641 |
| Less than 5 years old in poverty |
10.45% |
10.07% |
9.10% |
| 5-11 years old in poverty |
14.20% |
15.35% |
13.22% |
| 12-17 years old in poverty |
11.76% |
9.52% |
9.58% |
| 18-64 years old in poverty |
45.64% |
55.01% |
57.19% |
| 65 years old and older in poverty |
17.95% |
10.05% |
10.90% |
| |
| Total Households |
1,791 |
84,566 |
2,700,335 |
| Wage or salary |
72.53% |
76.15% |
81.24% |
| Self-employment |
2.23% |
7.81% |
11.00% |
| Social Security |
33.50% |
25.87% |
23.39% |
| Supplemental Security Income |
8.60% |
5.63% |
3.54% |
| Public Assistance |
5.47% |
4.72% |
2.46% |
| Retired |
20.71% |
16.38% |
18.81% |
| Interest Dividends or Net Rental Income |
18.31% |
28.34% |
38.22% |
| Other Types |
14.24% |
12.56% |
12.91% |
|
|
|
© 2010 DataShare Metro Richmond Hosted by Virginia Commonwealth University
|